NFL Betting Tips This Week: How to Build a Weekly Research Process
Every Monday morning during the NFL season, I open the same spreadsheet. It has sixteen rows – one for each game on the upcoming slate – and seven columns of data I fill in throughout the week. By Saturday evening, most rows have enough information to generate a view. Some produce a bet. Most do not. The discipline is in the process, not the outcome, and the process starts with understanding that “tips” are not predictions handed down from a mountaintop. They are conclusions drawn from a repeatable research workflow that anyone can build.
The NFL is the most heavily wagered league in the world. A single Sunday afternoon time slot generates more handle than an entire week of MLB or NBA action combined. That concentration of volume means the market is sharp – the lines are set by professionals who have access to the same data you do and more. Finding an edge requires a structured approach, not a hunch.
See also NFL betting strategy tips for long-term approaches.
Contents
A Weekly Research Workflow for NFL Bets
The week begins on Tuesday, when the initial lines for the following Sunday’s games are available at most UK sportsbooks. I record the opening spread, total, and moneyline for every game. These opening numbers are the market’s first assessment based on power ratings, home-field adjustments, and early injury information. They are imperfect – which is precisely why they matter. The gap between the opening line and where the line closes on Sunday morning represents the market’s learning during the week. Tracking that movement over a full season reveals which types of games the market consistently misprices at open.
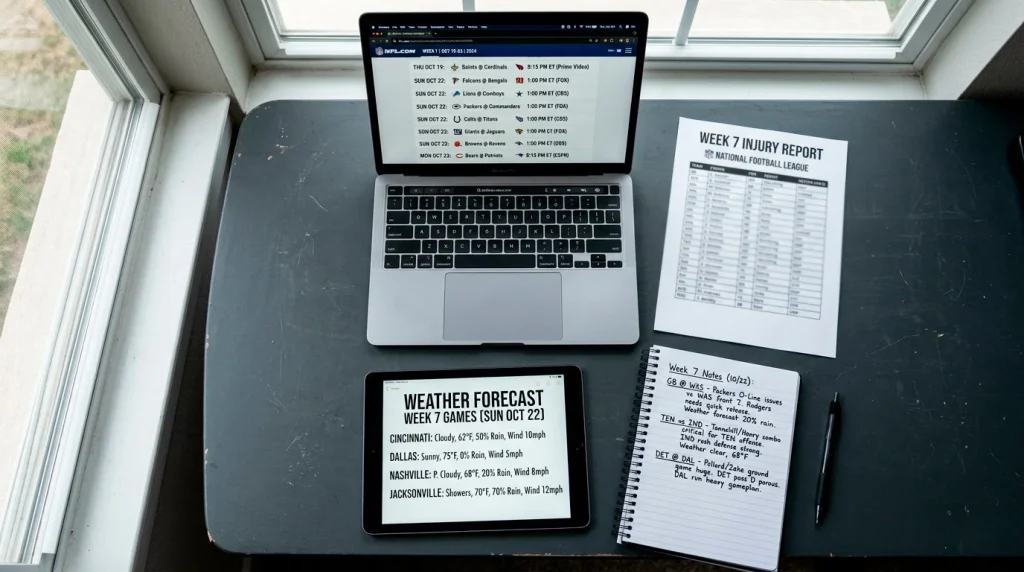
Wednesday and Thursday are the data collection days. I pull three categories of information. First, injury reports – the NFL requires teams to publish practice participation reports on Wednesday, Thursday, and Friday. A starting left tackle listed as “did not participate” on Wednesday is a data point. The same player listed as “did not participate” on Thursday is a trend. By Friday, when the final game-status designations drop (out, doubtful, questionable), the picture is complete enough to assess how each team’s available roster compares to the line set on Tuesday.
Second, I review the previous week’s advanced metrics. Yards per play, success rate on early downs, red-zone efficiency, pressure rate, and explosive play frequency. I do not build a model – I lack the statistical infrastructure for that – but I use these metrics to challenge or confirm the narrative. If a team won 27-10 last week and the public perception is dominance, but the metrics show they generated 4.2 yards per play against a weak defence and benefited from three turnovers, the narrative overstates the performance. That gap between perception and reality is where value lives.
Third, I check the weather forecast for outdoor games. Wind and precipitation affect passing volume and scoring. A game with 25 mph winds in Chicago has a structurally lower expected total than the same matchup played indoors in Las Vegas. Weather data is publicly available and consistently underweighted by casual bettors who place their bets on Thursday before forecasts solidify.
Injury Reports and Weather: Weekly Variables That Move Lines
Injury reports are the single most impactful weekly variable in NFL line movement. A starting quarterback listed as doubtful can move a spread by 3 to 7 points. A key defensive player’s absence might shift the total by 1 to 2 points. The magnitude of the adjustment depends on the player’s positional value and the quality of the replacement.
The timing of injury information creates betting windows. Lines set on Tuesday price in the expected injury situation. The Wednesday practice report provides the first official update. If a player the market assumed would play is suddenly listed as “did not participate,” the line adjusts – sometimes immediately at sharp sportsbooks, sometimes with a delay at slower-moving operators. That delay is a window, and UK punters who monitor the Wednesday report at 8 pm (when it typically drops in the UK time zone) can catch favourable prices before the broader market reacts.
In-play wagering generates over 62% of online sportsbook revenue, but the most overlooked edge in NFL betting is pre-match, driven by information that arrives during the week and is not fully priced until Saturday or Sunday. Weather is the clearest example. A forecast for heavy snow in Buffalo on Sunday morning is available by Thursday, but casual bettors who placed their overs on Tuesday have already moved the line upward. Sharp bettors who wait for the weather data and take the under at a number inflated by early over money are systematically exploiting a timing advantage.
I keep a weather threshold list: sustained winds above 20 mph, temperatures below minus 5 Celsius, precipitation probability above 60% for rain or any snow. When a game meets any of these thresholds, I add it to my “totals review” list and compare the current total to the expected scoring environment. This is not sophisticated modelling – it is a checklist that catches the most obvious weather-driven mispricings two or three times per season.
See also nfl bet online for the complete NFL betting guide.
Turning Research into Actionable Picks
The gap between research and a bet is narrower than most people assume but harder to cross than it looks. Having a view – “I think the Bengals are undervalued this week” – is not the same as having a bet. A bet requires a view plus a price. If you believe the Bengals should be -2.5 but the market has them at -3.5, your view is irrelevant at that price. The market disagrees with you by a full point, and you need to either find a sportsbook where the line is closer to your number or pass on the game entirely.
My filtering process reduces sixteen games to two or three bets per week, and some weeks to zero. The filter has three stages. First, does my research generate a view that disagrees with the market by at least one point on the spread or at least 1.5 points on the total? If not, pass. Second, is the disagreement supported by at least two independent data points – for example, an injury that the line has not fully adjusted for and an advanced metric trend that contradicts the public narrative? If only one data point supports the view, pass. Third, does the price available at my preferred sportsbooks offer value relative to my estimated probability? If the best available price embeds a margin that eliminates the edge, pass.
This filtering is aggressive. It eliminates most games most weeks. That elimination is the strategy. A bettor who finds genuine value in three games per week and bets only those three will outperform a bettor who bets ten games based on vague preferences – even if the three-game bettor has a lower raw win rate. The edge is in selectivity, not volume.
One final element: record everything. Every bet, every outcome, every piece of research that led to the decision. After ten weeks, your records contain patterns. Maybe you are consistently profitable on totals but losing on spreads. Maybe your Thursday Night Football bets perform worse than your Sunday afternoon bets. Maybe your weather-driven unders hit at 63% but your injury-driven spreads hit at 48%. Those patterns are your feedback loop. Without records, you are guessing about your own performance. With records, you are managing it.